
LTI Overview
The long-term incentive plan is based on performance shares. These are virtual shares reflecting the actual Fresenius share – but they are not backed by equity and do not carry any voting rights. Still, dividend payments will be reflected. At grant and payout, the value is calculated on the basis of the average Fresenius share price 60 trading days before grant and vesting. How many of your granted performance shares vest depends on the LTI target achievement.
How does it work in 1 minute
What's in it for you in 2 minutes (Simulation)

Grant
In September, you will receive an individual monetary grant in Euro which will be converted into performance shares – based on the average Fresenius share price 60 trading days before the grant.

Target Achievement
During the four years plan term, we will measure two performance targets – the net income growth and the relative total shareholder return.

Vesting
The target achievement for both targets will determine how many performance shares actually vest. Your granted performance shares will be multiplied with the overall target achievement – this is the number of performance shares that vest. It can be between 0% and 200% of your granted performance shares.

Payout
Your actual payout equals your vested performance shares multiplied with the applicable share price. Again, the basis is the average share price 60 trading days before vesting.
The performance targets
There are two performance targets determining how many of your granted performance shares will actually vest – the net income growth and the relative total shareholder return.
Both targets are weighted equally at 50% each.
We chose these two targets to reflect both internal and external long-term performance of Fresenius. The net income growth reflects our growth in profit. The relative total shareholder return compares our success to our competitors.
Both targets will be measured over a four-year measurement period. It will start with the calendar year in which you received your grant and end with the calendar year before vesting.
...
Net income growth
Our internal target is based on the growth rate of the adjusted consolidated net income after currency adjustments – in short: the net income growth. This is the percentage gain or loss over our plan term and indicates Fresenius` growth in profits. Our target is to achieve 8% growth in four years – achieving this means a payout of 100% of your granted performance shares.
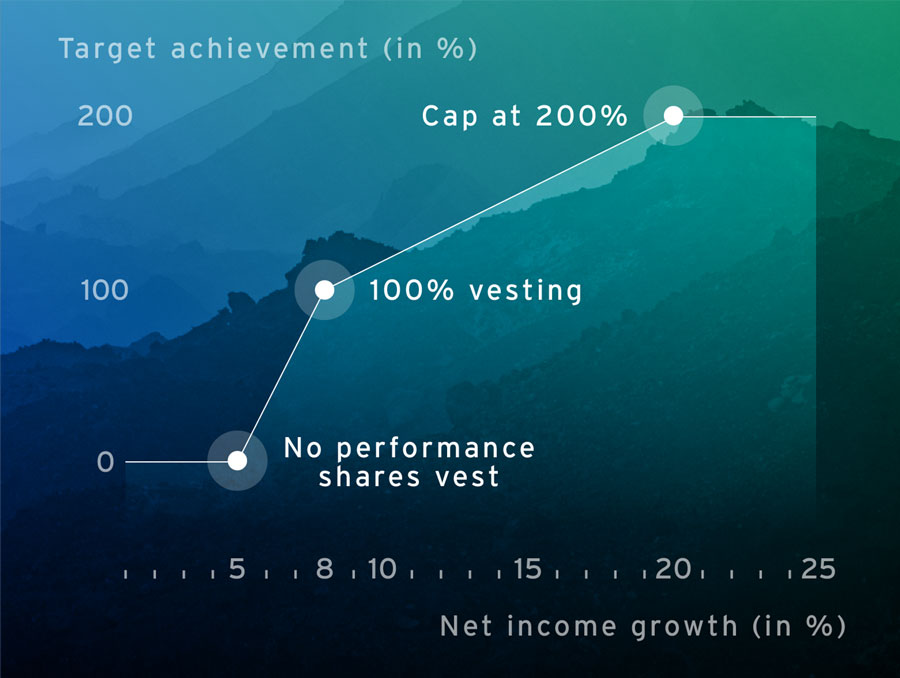
Target achievement overview
With a net income growth of 20%, target achievement reaches 200% – where it is capped. At a minimum, we need 5% growth to reach a vesting. Between 5% and 8% as well as between 8% and 20% intermediate values will be calculated by linear interpolation – so partial target achievement will also lead to a respective vesting.
...
Relative Total Shareholder Return
To compare our success to our competitors, we take a look on the relative total shareholder return (TSR) within the STOXX Europe 600 Health Care index. This sector index includes the STOXX Europe 600 companies with Heath Care as a primary revenue source. The TSR combines Fresenius` share price development and dividends paid. This shows the total return to our shareholders in comparison to our competitors.
Thus, we measure how many competitors within the index we outperform after four years. We will only compare Fresenius to those companies who are part of the index for the whole performance period – the companies belonging to this sector index may change during this time. Check out the current components.
...

Target achievement overview
Our target is to perform better than 50% of our competitors. We rank the companies in the STOXX Europe 600 Health Care index according to the TSR results over four years. Outperforming by 50% results in a vesting of 100% of your granted performance shares. Vesting can be up to 200% of your granted performance shares, if we outperform 75% or more. Our threshold is to reach a higher TSR than 25% of our competitors. In between target achievement will be calculated by linear interpolation.
...